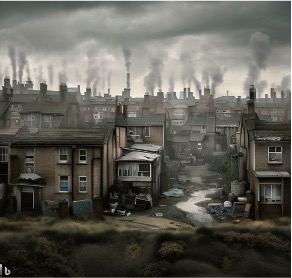
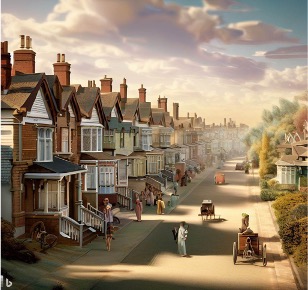
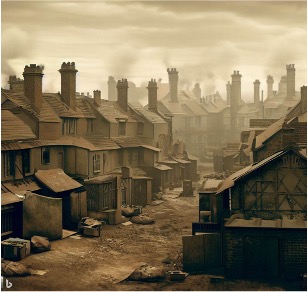
We give the image generator some descriptors about health, such as "healthy residential area", to generate relevant images. In these images you can move your mouse to explore the details in the image that express the health criteria identified by the AI. The images are generated through Bing's Image Generator, which works with Open AI, which developed DALL-E 2. It was trained by providing it with a large amount of social material, which to some extent represents the perceived criteria of most people. You can learn more about "what is healthy/unhealthy" through AI.
Wait a moment ––––
During your exploration, did you feel anything strange?
If you find it odd, then you're on the right track!
We deliberately swapped the positions of "unhealthy" and"healthy" in the descriptors, so that "healthy" actually represents "unhealthy," and "unhealthy" represents"healthy."
If you feel strange, it means you already have your own definition of health.
Why not try sharing your definition? Try categorizing the elements mentioned above!
Classify them according to your idea
Detached House
Green Lawn
Terraced Houses
Blue Sky & White Clouds
Sunshine
Back-to-back Houses
Smog
Waste
Dust
Window
Drainage System
Moss & Stains
Sewage
Forests
Clean Roads
Chimneys
Smokes
Puddles
Scrap
Terraced Houses
Floor Tiles
Storage Boxes
Small Window
Unprofessional Workers
Crowdedness
Clean Wall
Thanks for your exploration!
During this journey, you've gained insights into elements related to health through AI-generated images. Have you noticed any issues here?
Some elements representing health now and in the 1900s are repeated, but there are also differences. Does this imply that the definition of healthy has changed over different eras? When we talk about health, certain elements come to mind, and similarly, some elements are perceived as representing healthy or unhealthy.
Did you feel the symbolic significance of these elements during the categorization process?
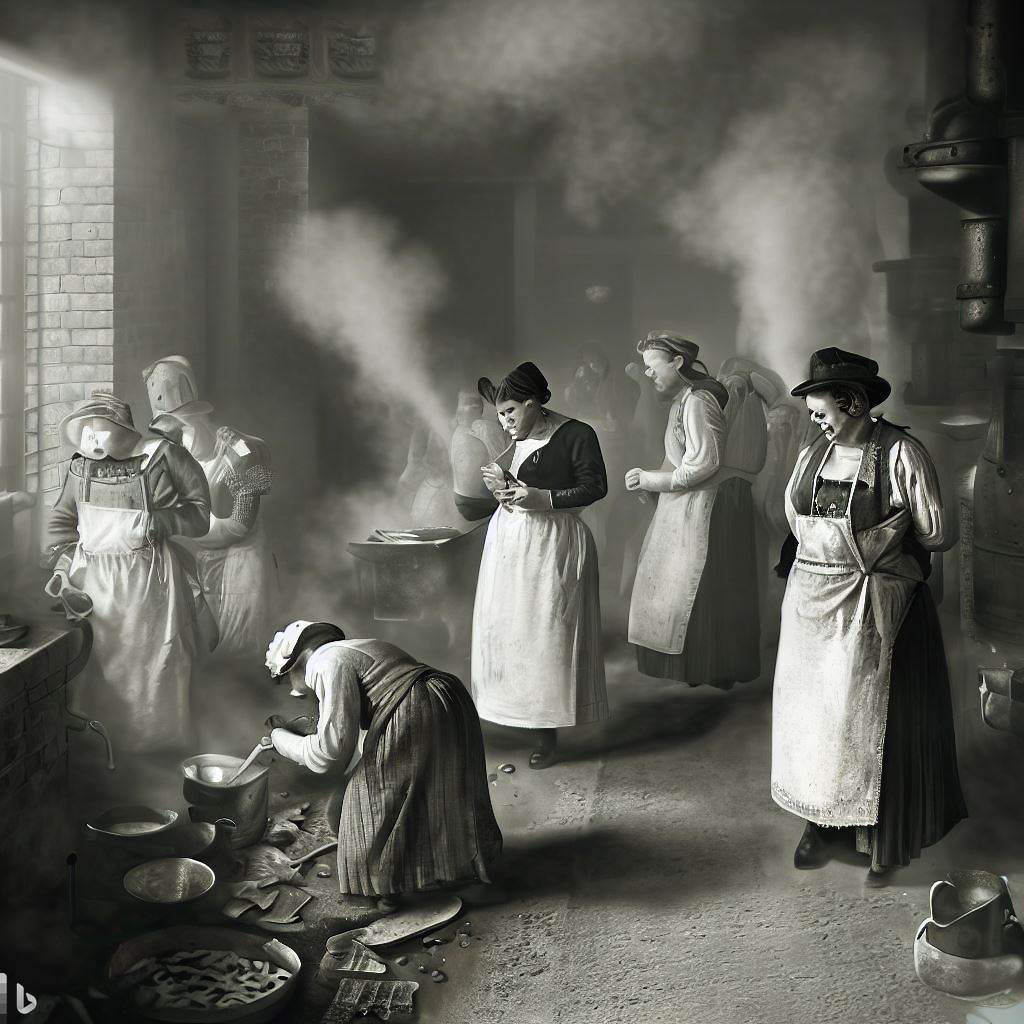
Next, we will look back at historical authentic materials and reflect on the present through history.
Let's see how people perceived healthy and unhealthy a century ago!
Data Visualisation
In regards to the data processing for our project, the original book provides a historical medium that displays simple information about Quarry Hill's inhabitants and their occupations, the only way to recognize that this area was unsuitable to live in is by analysing some keywords like ‘ashpit’, ‘wash house’, or ‘vacant lands’ were included in the residence area. This offers some insights into the index of what was defined as unhealthy in 1900 to some extent. However, we encountered a limitation in the scope of the data scraping at this level, prompting us to seek more quantitative standards from the past. Despite our efforts, we encountered difficulties in finding specific quantitative standards. For instance, The Working Classes Dwellings Act, 1890 describes Quarry Hill as an unhealthy area, but it still lacks detailed quantitative standards, potentially reflecting the Leeds City Council's subjective observations. For example, among the data we collected, we found information on mortality rates among the working class, middle class, and upper class. Due to the high mortality rate among the working class, and the fact that the majority of Quarry Hill residents were from the working class, it may have been assumed that this area was unhealthy, although this assumption contrasts with the more robust and objective standards of modern health standards.
The reason we opted for this data source pertains to the inadequacy of past standards for assessing the health status of an area. Relevant data was only available for Leeds, and given that Quarry Hill was classified as an unhealthy area of Leeds, we had reason to believe that the data would indicate a worse situation than that of Leeds overall.
creative coding
Data scraping
More Info

More Info
More Info
More Info
More Info
‘Quarry Hill unhealthy area, 1900: Book of reference(v.4)’ shows brief information of people who lived there. It provides a historical medium to understand the health standards of the time through data such as descriptions of houses or occupations. This old data book shows how the area was unhealthy to live in, but there was no specific standard of healthy and unhealthy in this book.
In the past, the criteria for judging healthy were inadequate. According to the book, the only way to recognise that this area was unsuitable to live in is by analysing some keywords like “ashpit”, “wash house”, or “vacant lands” were included in the residence area. Whereas the criteria for judging healthy are becoming more diverse and scientific nowadays. For example, there is a health criterion analysing Leeds including access to fast food restaurants, pubs, health services, leisure facilities, and gambling outlets, many of which were previously completely ignored (Lavigueur, 2020).
of QuarryHowever, when comparing the past and these days of Quarry Hill, using symbols to convey meaning is common thing. When we learn about this historical collection, “unhealthy” becomes the most impressive symbol. We identify it as unhealthy by modern recognition due to the cognitive inertia but ignoring the fact that the meaning of unhealthy is changing! There exists a difference between the unhealthy of the 1900s and the unhealthy of today. For instance, crowding and poverty can be associated with this book, both denote unhealthy are still used today, but fast food was not associated with unhealthy at that time. Our website does not say this explicitly, because we want you to understand that data does not tell the whole story and symbols make us miss something.
Another problem is that these symbols may have biased meanings. In the image of AI on the website, we show how AI caters to our categorization. When we talk about unhealthy, it's always accompanied by smoke. However, in many cases the smoke is not unhealthy, such as steaming dumplings. In modern times, the use of AI technology to classify data based on dichotomies has become more prevalent, and this has the potential to reinforce and perpetuate inaccurate or biased narratives.
To sum up, these historical data is not meaningless.They are part of the steps of human development. It is possible that society 100 years from now will view some of current criteria as inadequate. “The process of interpretation of symbols is limited by cultural rules of thought or conventions” (Hodge and Kress, 1988, p.20). By applying a social semiotic lens, it is better to understand how meaning is constructed and communicated in society and work to create more accurate of the world. Moreover, data cannot exist alone. Analysing and understanding scraped data are up to human. Thus, understanding symbols of the past and nowadays should be more careful and have different perspectives when we use the data.
Reference:
Hodge, B. and Gunther K. 1988.Social semiotics. Ithaca, NY: Cornell Univ. Pr.
Lavigueur, N. 2020. The five most healthy and unhealthy places in Leeds mapped. LeedsLive. [Online].[Accessed 24 April 2023]. Available from: https://www.leeds-live.co.uk/news/leeds-news/five-most-healthy-unhealthy-places-19363665.